We were lucky to have our own booth at Forskningstorget in Oslo from the 19th and 20th of September. Together with 32 other research groups we presented our research topics in the context of this year’s theme “Environment”. Forskningstorget (“The science fair”) is a part of Forskningsdagene (“Science days”) in Oslo. We had lots of visitors and perfect weather conditions throughout the weekend.
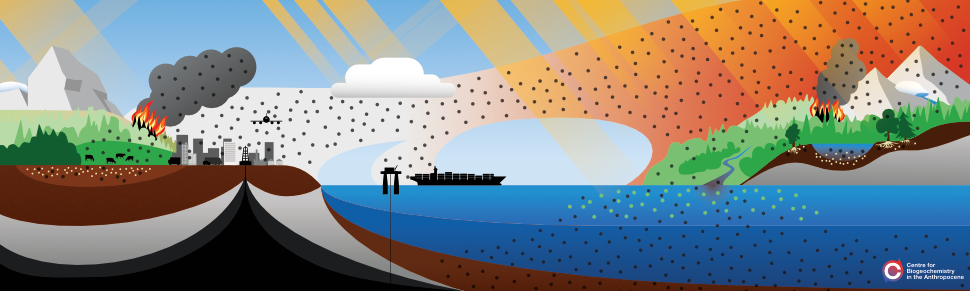
In our booth, we focused on the carbon cycle. We had three main stations and a large background illustration that placed the human influence on the carbon cycle in the context of the natural cycles.

The carbon pump
The first station was a simplified physical model of the carbon cycle where black water represented carbon and aquaria the different connected places of carbon storage. The volume of the aquaria was scaled to the amount found in the carbon pools. A battery of peristaltic pumps and pipes transferred the “carbon” from one pool to the other according to the relative rates we find in nature. Like this, we captured the exchange between the oceans, the atmosphere, the plants and the soils.
 An unconnected aquarium represented the fossil pools in the earth crust. We chose to do this, given that the amount of new "natural" fossilization is minimal. To show the use and burning of fossil fuels, we transferred carbon from this container to the atmosphere using a kitchen cup.
While sedimentary rocks of the earth store most carbon, the exchange with the other carbon pools is tiny. Therefore we did not include a separate giant aquarium representing these. Likewise, we did not explicitly show the sediments at the bottom of the sea, as new carbon deposition in the ocean is also slow compared to the other exchanges. And to represent this correctly would have required even more independent pumps.
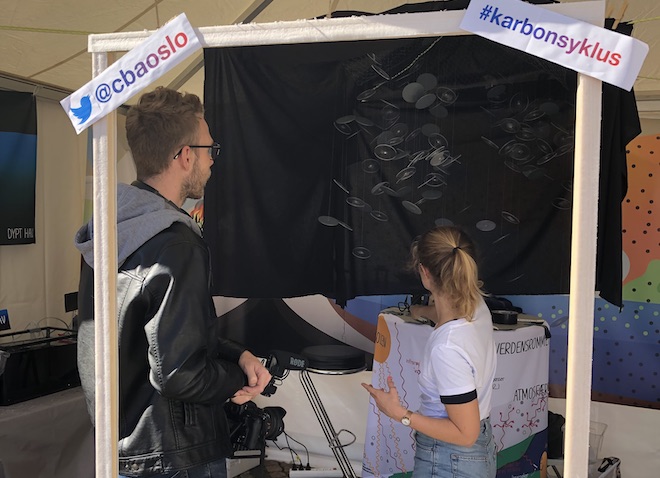
The greenhouse effect
The second station was a physical model of the earth atmosphere which was used to explain the greenhouse effect. Grey opaque disks illustrated greenhouse gases and transparent disks molecules such as atmospheric oxygen and nitrogen. The visitors could then simulate infrared radiation on its way through the atmosphere with a red laser pointer. One side had more greenhouse gases compared to the other. This, made it harder to “shoot” into space as the radiation was absorbed on its way, compared to the side with more “transparent” molecules. A poster visualizing and explaining the process was placed in the background. Download a high resolution version in Norwegian or in English.

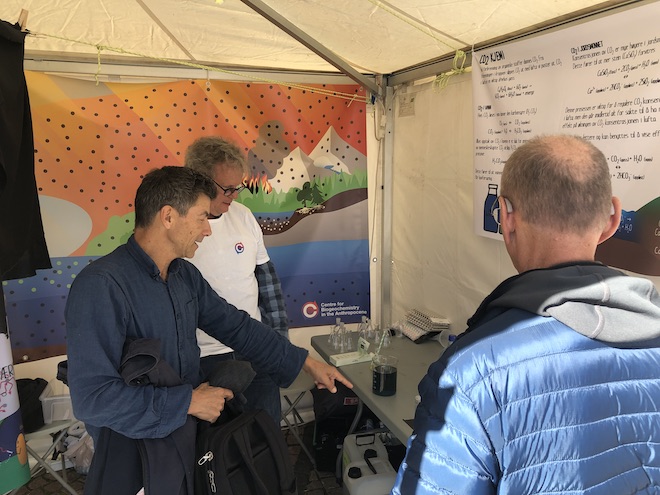
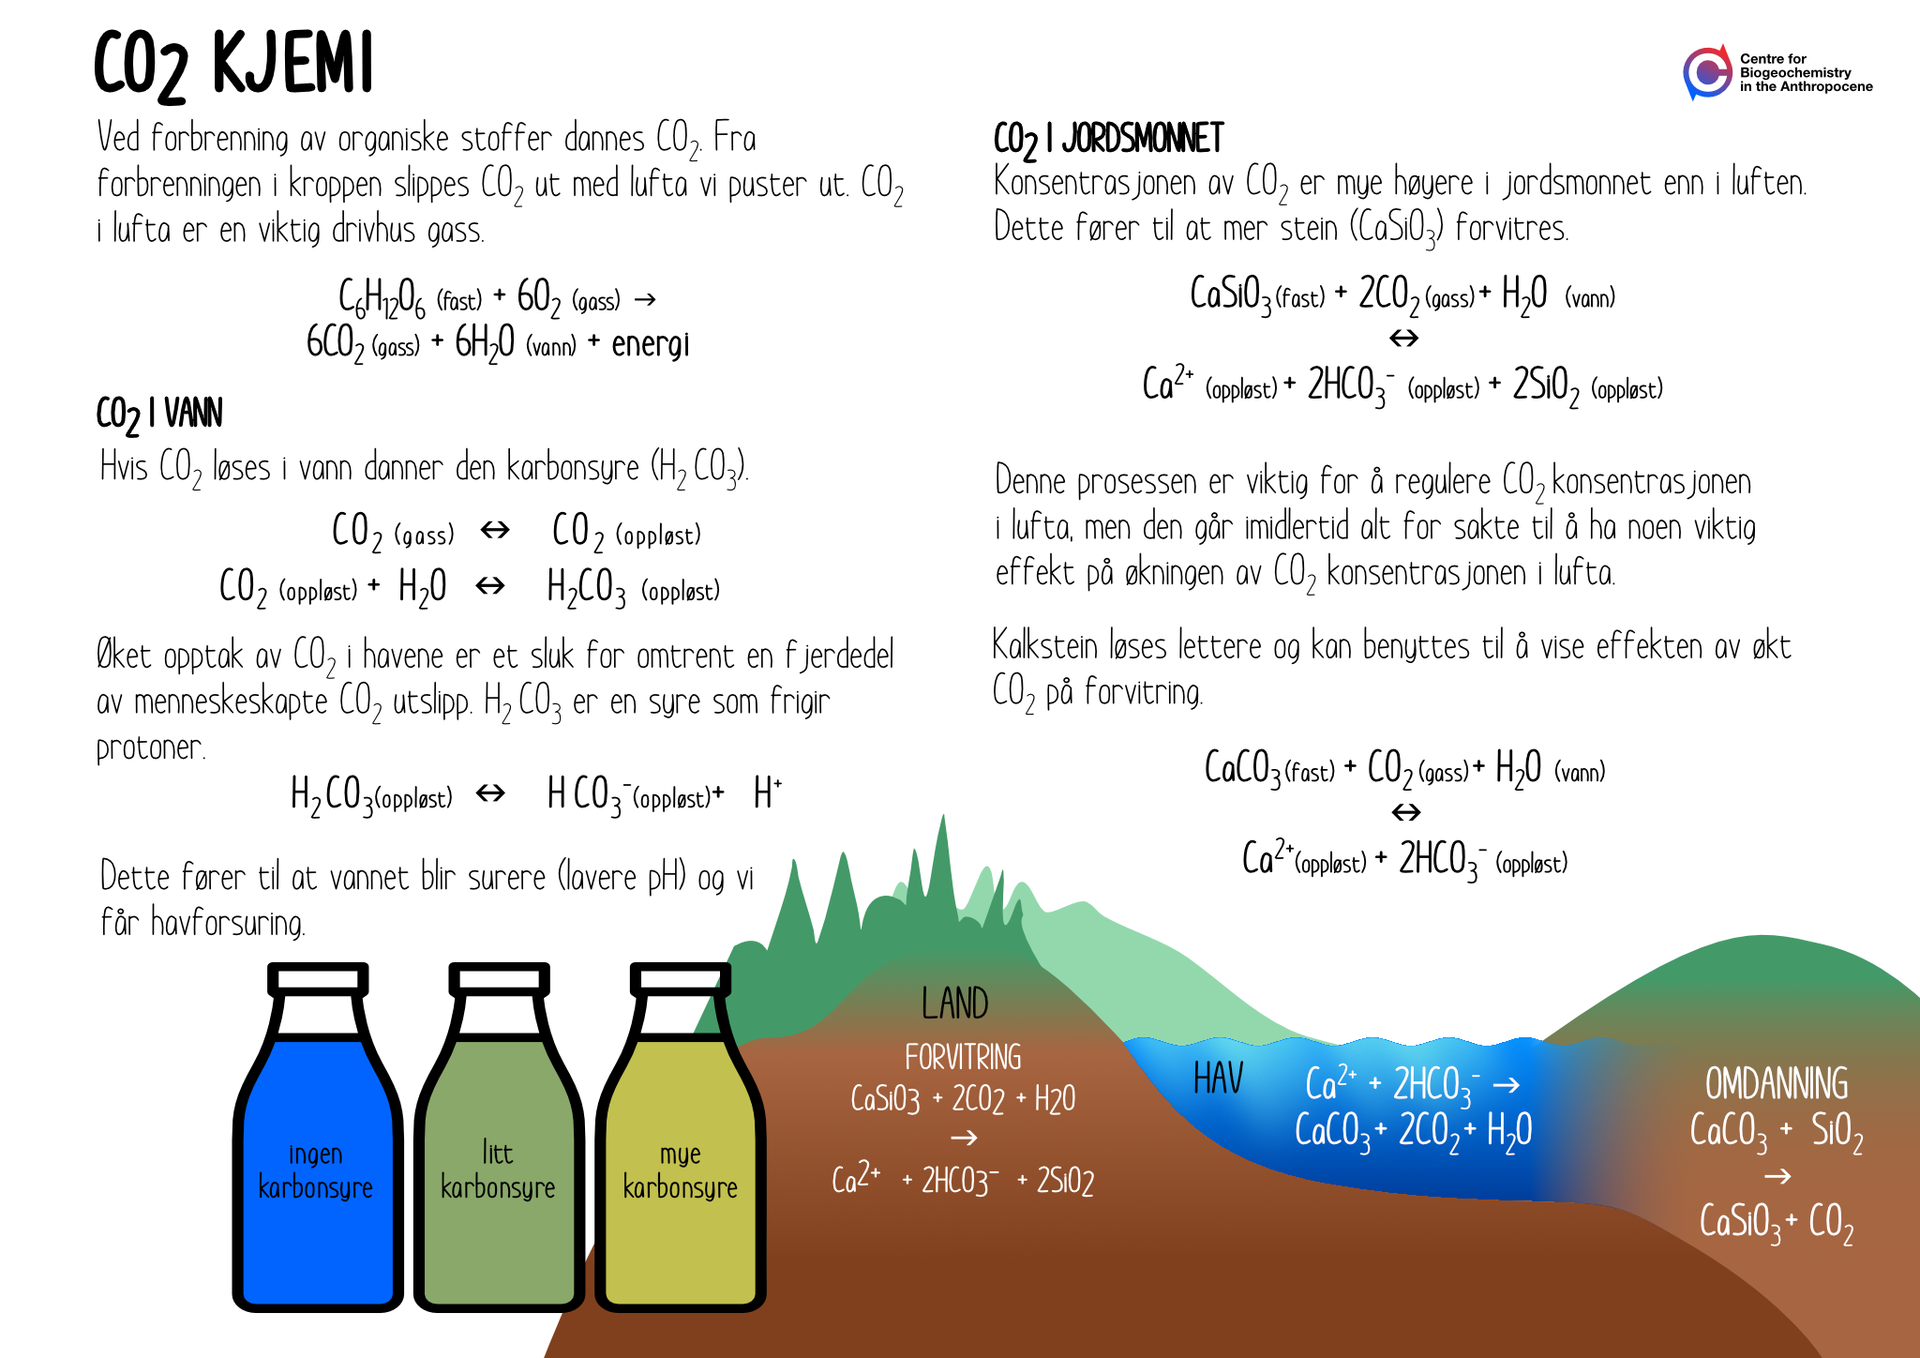
CO2 chemistry
Increased CO2 levels in the air lead to more dissolved carbon in the earth waters. In the third station, we had small experiments showing how this works and what consequences it can have. In one, our visitors could test how the CO2 in their breath acidifies the water. By blowing into a small glass with water, they could observe a colour change from blue to yellow, which indicated a reduction in pH level. A second experiment illustrated the effect of acidic waters on limestone. A small amount of calcium carbonate is either mixed into carbonated water or with ordinary tap water. While it dissolves quickly in the first one, it does not in the ladder, showing the erosive effect of acidic waters. The chemical processes were illustrated in the accompanying poster.