
Shephard, G.E., K.J. Matthews, K. Hosseini, M. Domeier. 2017. On the consistency of seismically imaged lower mantle slabs. Scientific Reports. v7. doi:10.1038/s41598-017-11039-w
Earth in motion
The surface of the Earth is in constant motion, with new crust being formed at mid-oceanic ridges, such as the Mid-Atlantic Ridge, and older crust being destroyed at convergent margins, such as around the Pacific “Rim of Fire”. Where oceanic plates plunge into the mantle are termed “subduction zones” (orange lines in the GIF below). Indeed, much of the seafloor that existed when the dinosaurs roamed the Earth has long since been subducted and is now deep in the Earth’s mantle. This constant recycling of oceanic basins means that the Earth’s surface can only tell us so much about the deep geological past - the innards of our planet holds much of this information, and we need to access, visualize, and disseminate it.
Imaging the insides
Using information from earthquake data, seismologists can produce models of the Earth’s interior. Similar to a medical X-ray scan that looks for features within the human body, these “seismic tomography” models image the internal structure of the Earth. However, there are many different types of data that can be used to generate these models, each with varying degrees of resolution and sensitivity to the real Earth structure, and choices in data processing techniques. There are so called P-wave models based on the compressional waves, and S-wave models based on slower shear waves. This variability has led to dozens of tomographic models that are now available in the scientific arena, which all have slightly different snapshots of the Earth. Importantly, the old, cold oceanic plates that have been subducted mean that seismic waves pass through them more quickly than the surrounding mantle (in the same way that sound travels faster through solids than air). It follows that these subducted plates (slabs) can be “imaged” seismically (usually these slab regions are coloured blue in seismic tomography model - see video by co-author Kasra Hosseini below).
Which tomography model(s) should be used?
Are models based on P- or S-waves more likely to pick up a feature?
How many models are sufficient to say that a deep slab can be imaged robustly?
Voting maps
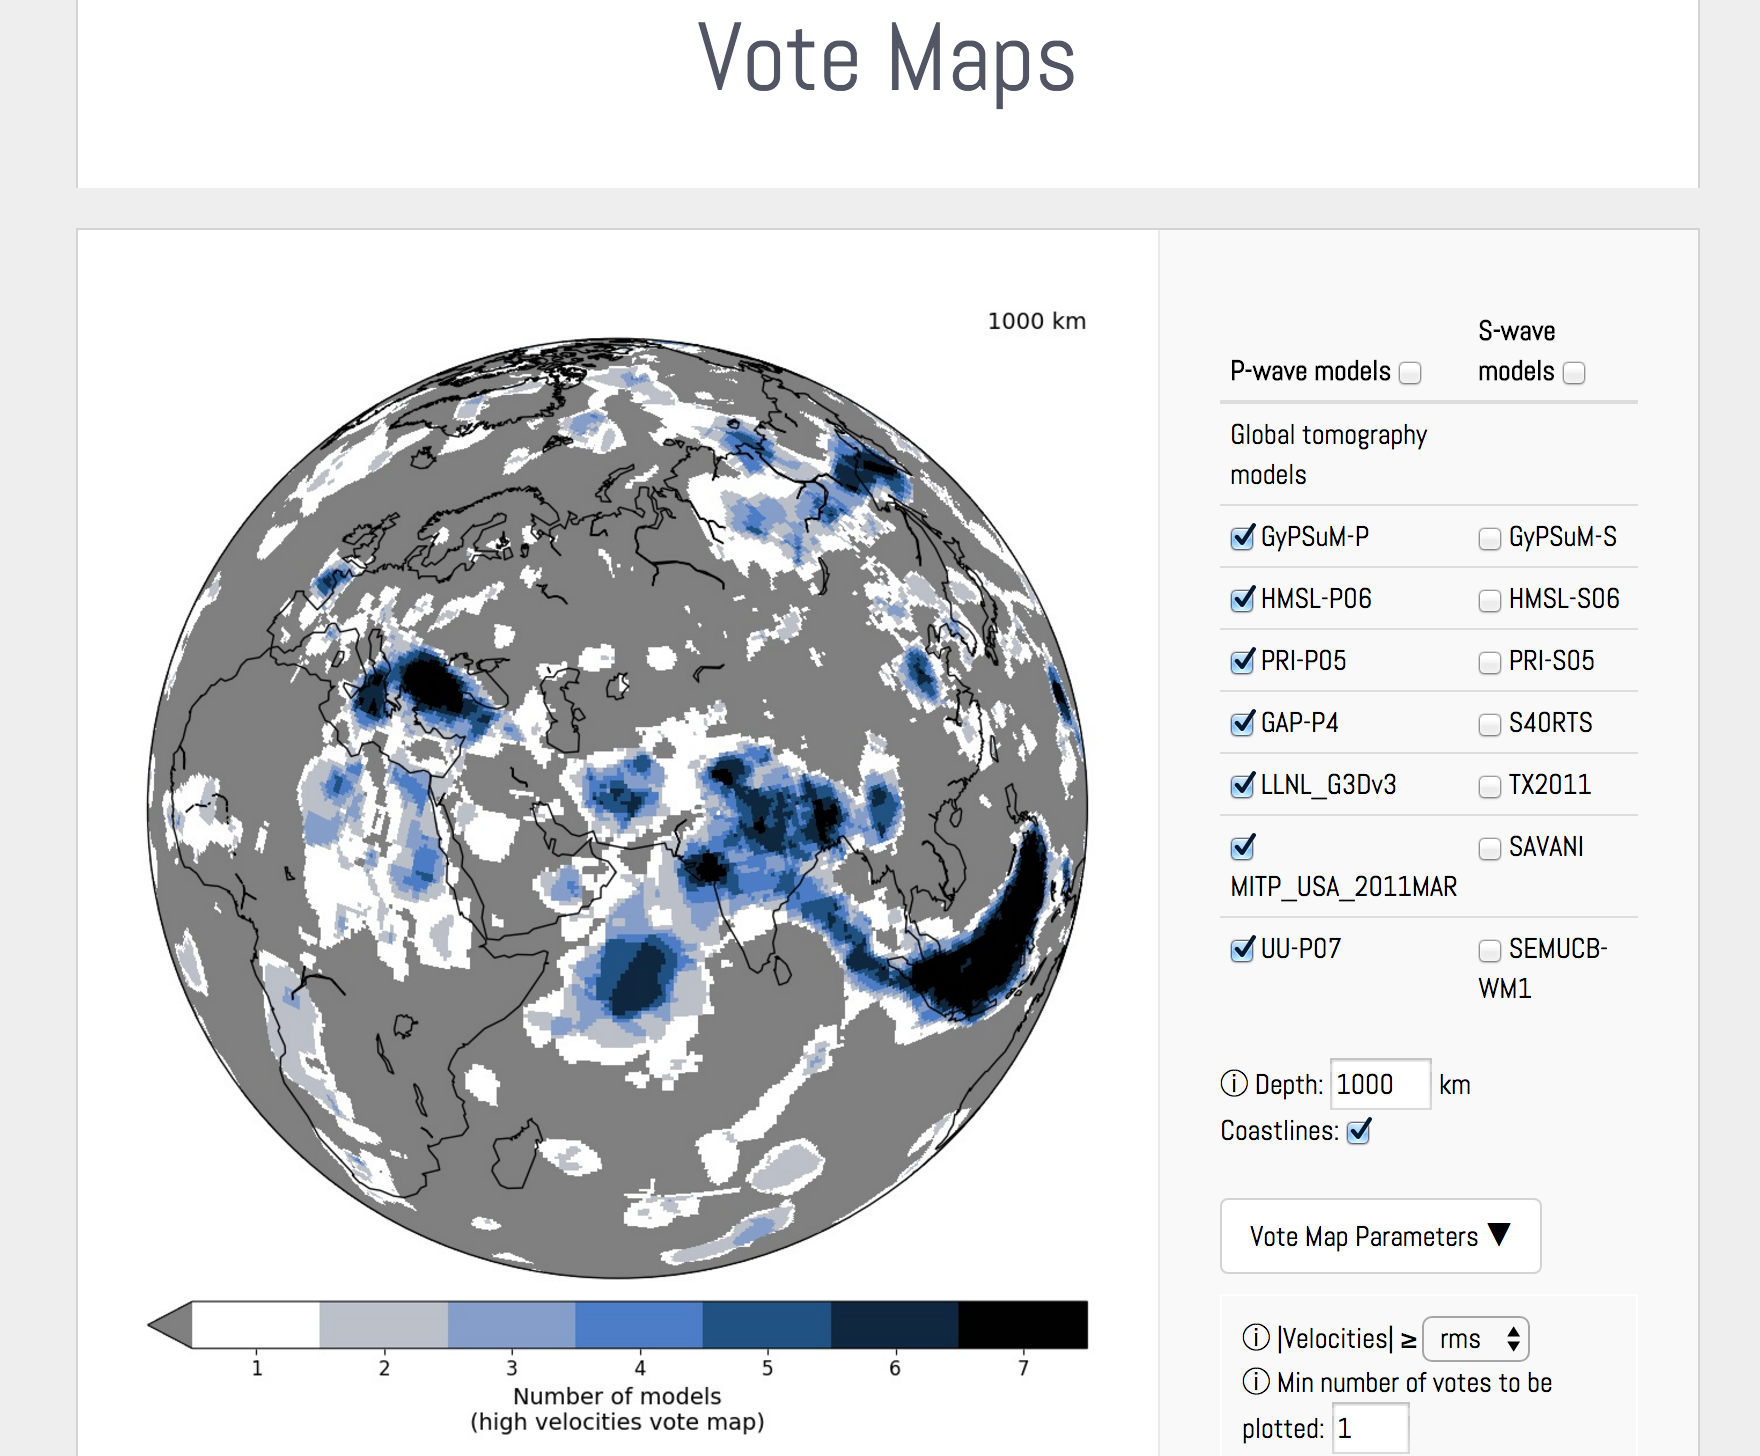
To facilitate solutions to these questions, a novel yet simple approach was undertaken. Different tomography models were combined to generate counts, or “votes,” of the agreement between models - a sort of navigational guidebook to the Earth’s interior. A high vote count means that an increased number of tomography models agree that there could be a slab at that location. For the study in Scientific Reports the focus was on slabs in the lower mantle (700-2850 km depth) but the process can be undertaken for shallower depths, and for other features such as mantle plumes. The maps show the distribution of the most robust slabs at different depths – the challenge is to now try and verify the features and potentially link them to subduction zones at the surface back in time. Many studies have started to undertake a similar exercise on both regional and global scales, but these vote maps can now serve as an easy resource for the community to continue this task.
Secrets in depth
When viewing the vote maps either on a surface map projection or as a vertical slice, many interesting features are displayed. A bit like dessert-time discussions about the best way to cut a cake, so too are the ways of imaging and analyzing the Earth. Do you slice it horizontally and see things that might correspond to the same age all over the globe? Or slice vertically to see a spectrum of ages (depths) at a given location? Or perhaps the 3-D rendering a volumetric body would be most insightful?
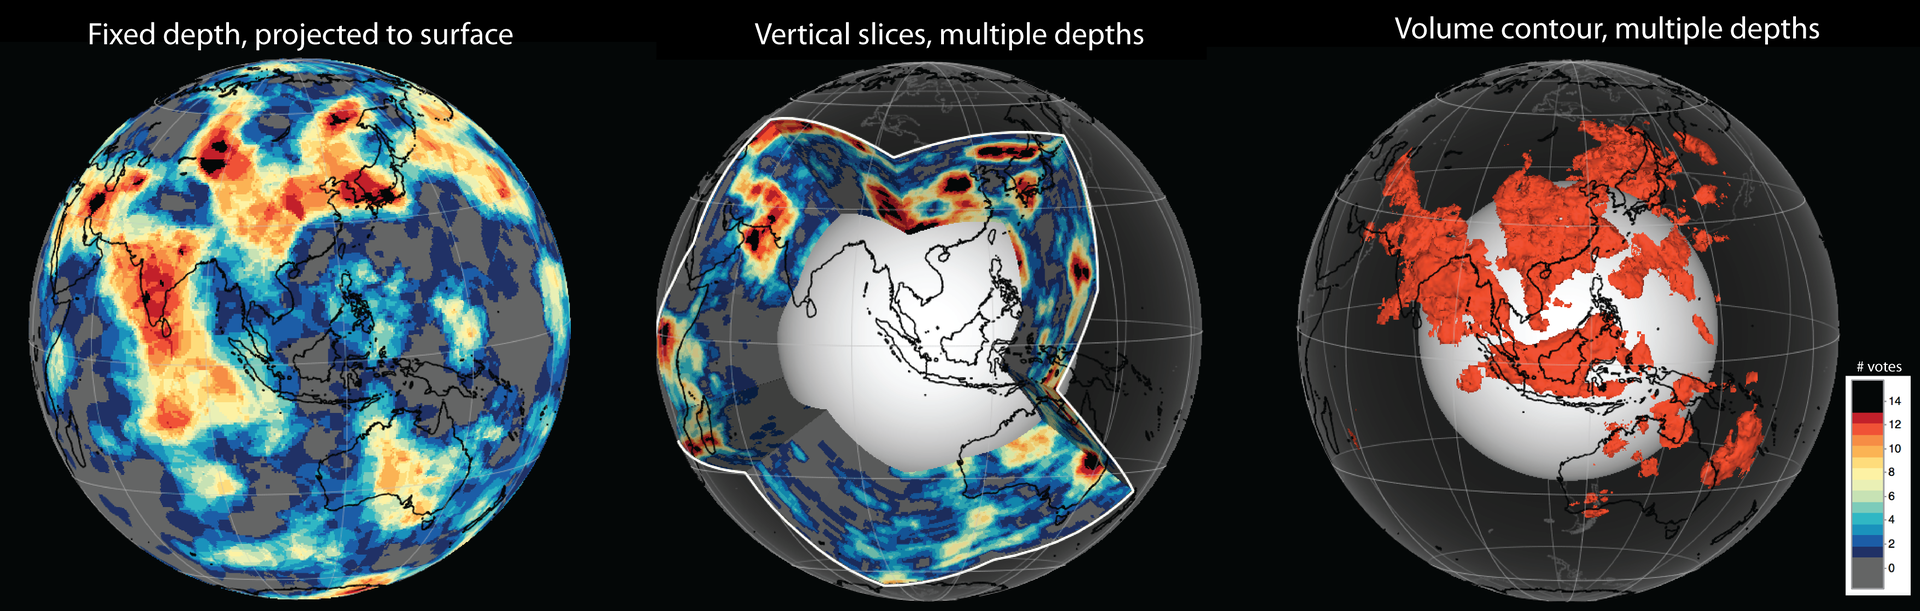
By comparing the changes in vote counts with depth, some intriguing results were found. An apparent increase in the amount of the slabs was found around 1000-1400 km depth. This could mean that about 130 Million years ago more oceanic basins were lost into the mantle, or perhaps there is a specific region in the mantle that has “blocked” the slabs from sinking deeper for some period of time. This observation and numerous other amazing features revealed by our new maps have already lead to discussions with researchers in plate tectonics, mantle dynamics, and mineral physics.
A resource for the community
Having accessed the different tomography models provided by different groups or repositories, this study was facilitated using open-source software (Generic Mapping Tools and GPlates). An important component of reproducible science and advancing our understanding of Earth is to make datasets and workflows publically available for further investigations. An online toolkit to visualize seismic tomography data is being developed by the co-authors and a preliminary vote maps page is already online. Here, vote maps for a sub-selection of tomography models can be generated, including with a choice in colour scales and with overlays of plate reconstruction models. More functionality will soon be available – so watch this space!
Corresponding author contact details: Grace Shephard g.e.shephard@geo.uio.no