The topic’s history should be traced back to at least (Yule, 1927) and the various methods should be implemented in a user-friendly Matlab program. The methods should include all the common spectral methods (see e.g. INF4480), the linear and circular spectral analysis methods of (Stothers, 1991) based on peak values only, and the singular spectrum analysis of (Courtillot et al, 2021). Related data such as those considered in (McIntosh et al, 2020) and others should also be analyzed and the coherence should be found between those and the sunspot number, see e.g. (Holm, 2015).
An example of spectral analysis is here:
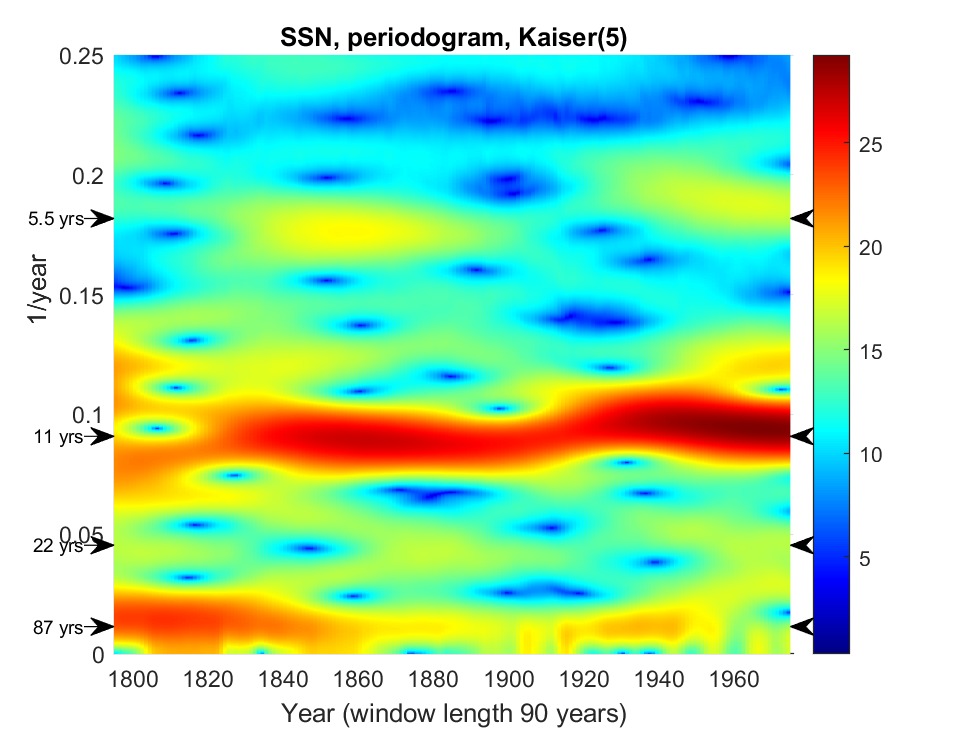
The raw data and more examples can be found here, https://la3za.blogspot.com/2021/01/eleven-and-87-year-sunspot-cycles.html. Analysis of historical data reconstructed by proxy several millennia back is also of interest, see (Usosklin, 2017). This paper also contains a tutorial introduction to the topic of sunspots.
References:
- Yule, G. U. (1927). VII. On a method of investigating periodicities in disturbed series, with special reference to Wolfer's sunspot numbers. Philosophical Transactions of the Royal Society of London. Series A, 226(636-646), 267-298.
- Stothers, R. B. (1991). Linear and circular digital spectral analysis of serial data. The Astrophysical Journal, 375, 423-426.
- Courtillot, V., Lopes, F., & Le Mouël, J. L. (2021). On the Prediction of Solar Cycles. Solar Physics, 296(1), 1-23.
- McIntosh, S. W., Chapman, S., Leamon, R. J., Egeland, R., & Watkins, N. W. (2020). Overlapping magnetic activity cycles and the sunspot number: forecasting sunspot cycle 25 amplitude. Solar Physics, 295(12), 1-14.
- Holm, S. (2015). Prudence in estimating coherence between planetary, solar and climate oscillations. Astrophysics and Space Science, 357(2), 1-8.
- Usoskin, I. G. (2017). A history of solar activity over millennia. Living Reviews in Solar Physics, 14(1), 3.