Steep slope permafrost distribution
Permafrost is defined as ground material that remains permanently at/or below 0°C (conventionally 2 years minimum). Since most of permafrost grounds contain ice, in the pore spaces or other discontinuities such as fractures in bedrock, permafrost degradation (increase of its temperature and thawing), affects ground morphology and stability.
Why are steep slope permafrost studies so relevant?
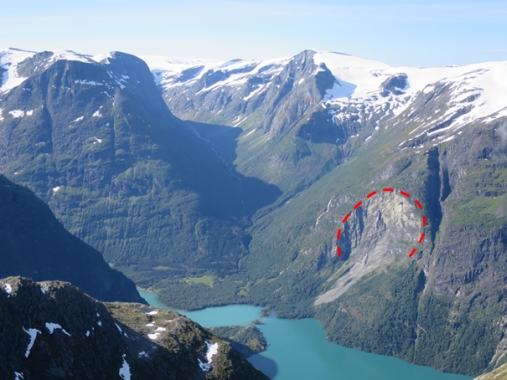
In steep permafrost slopes, degrading permafrost is therefore known as a triggering factor of rock falls. In Norway, many rock walls lie above sea or lakes. These water bodies constitute a high potential for impact waves that already had dramatic consequences for human lives and infrastructures during the past, such as in Loen in the Municipality of Stryn (Figure 1).
To better understand the role of permafrost in slopes mechanical properties and failures, and to make progress for risk mitigation, knowing the distribution of permafrost in steep slopes is a prerequisite. Former studies have estimated that the permafrost covers about 6 to 8% of the Norwegian territory but its distribution in rock wall is more complex and its investigation requires specific approaches. Therefore, one of the major tasks of the CryoWALL project is to assess permafrost distribution in the steep slopes of Norway.
Measuring and mapping rock wall permafrost
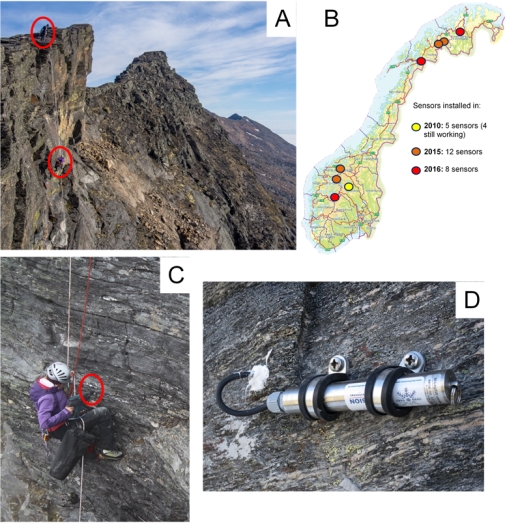
To assess and map the distribution of permafrost in the steep slopes of Norway, 20 temperature sensors were installed at the rock surface (10 cm depth) along a latitudinal profile during summers 2015 and 2016 (Fig. 2). Sensors cover various environments from 60°50’N to 69°46’N, and various elevations and aspects. These new network completes the 4 loggers installed in Jotunheimen in 2010 (in the framework of the CryoLINK project.
In August 2016, the first year of records was downloaded for the 12 sensors installed in 2015 while 8 other sensors were installed. The data from the 4 sensors located in Jotunheimen were also downloaded the past summers and 5 years of records are now available.
All the available data were subject to a preliminary data exploration in order to define the most important controlling factors of rock surface temperature and define the suitable data to model and map the distribution of permafrost in steep slopes.
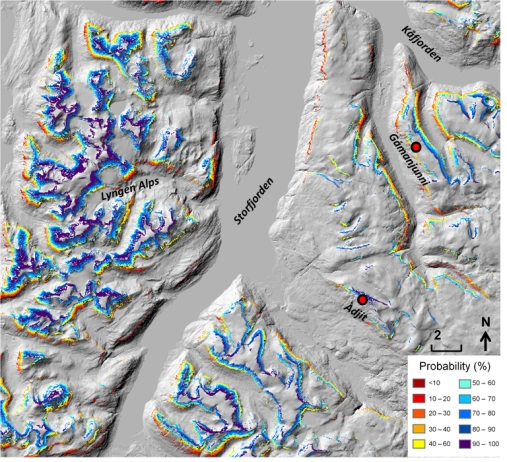
The model is then used to map the rock surface temperature which is then turned into of probability of permafrost occurrence which gives a percentage of chance that permafrost exists under the given surface area (Fig. 3). Such a map will be realized for the entire Norway in the framework of this project.