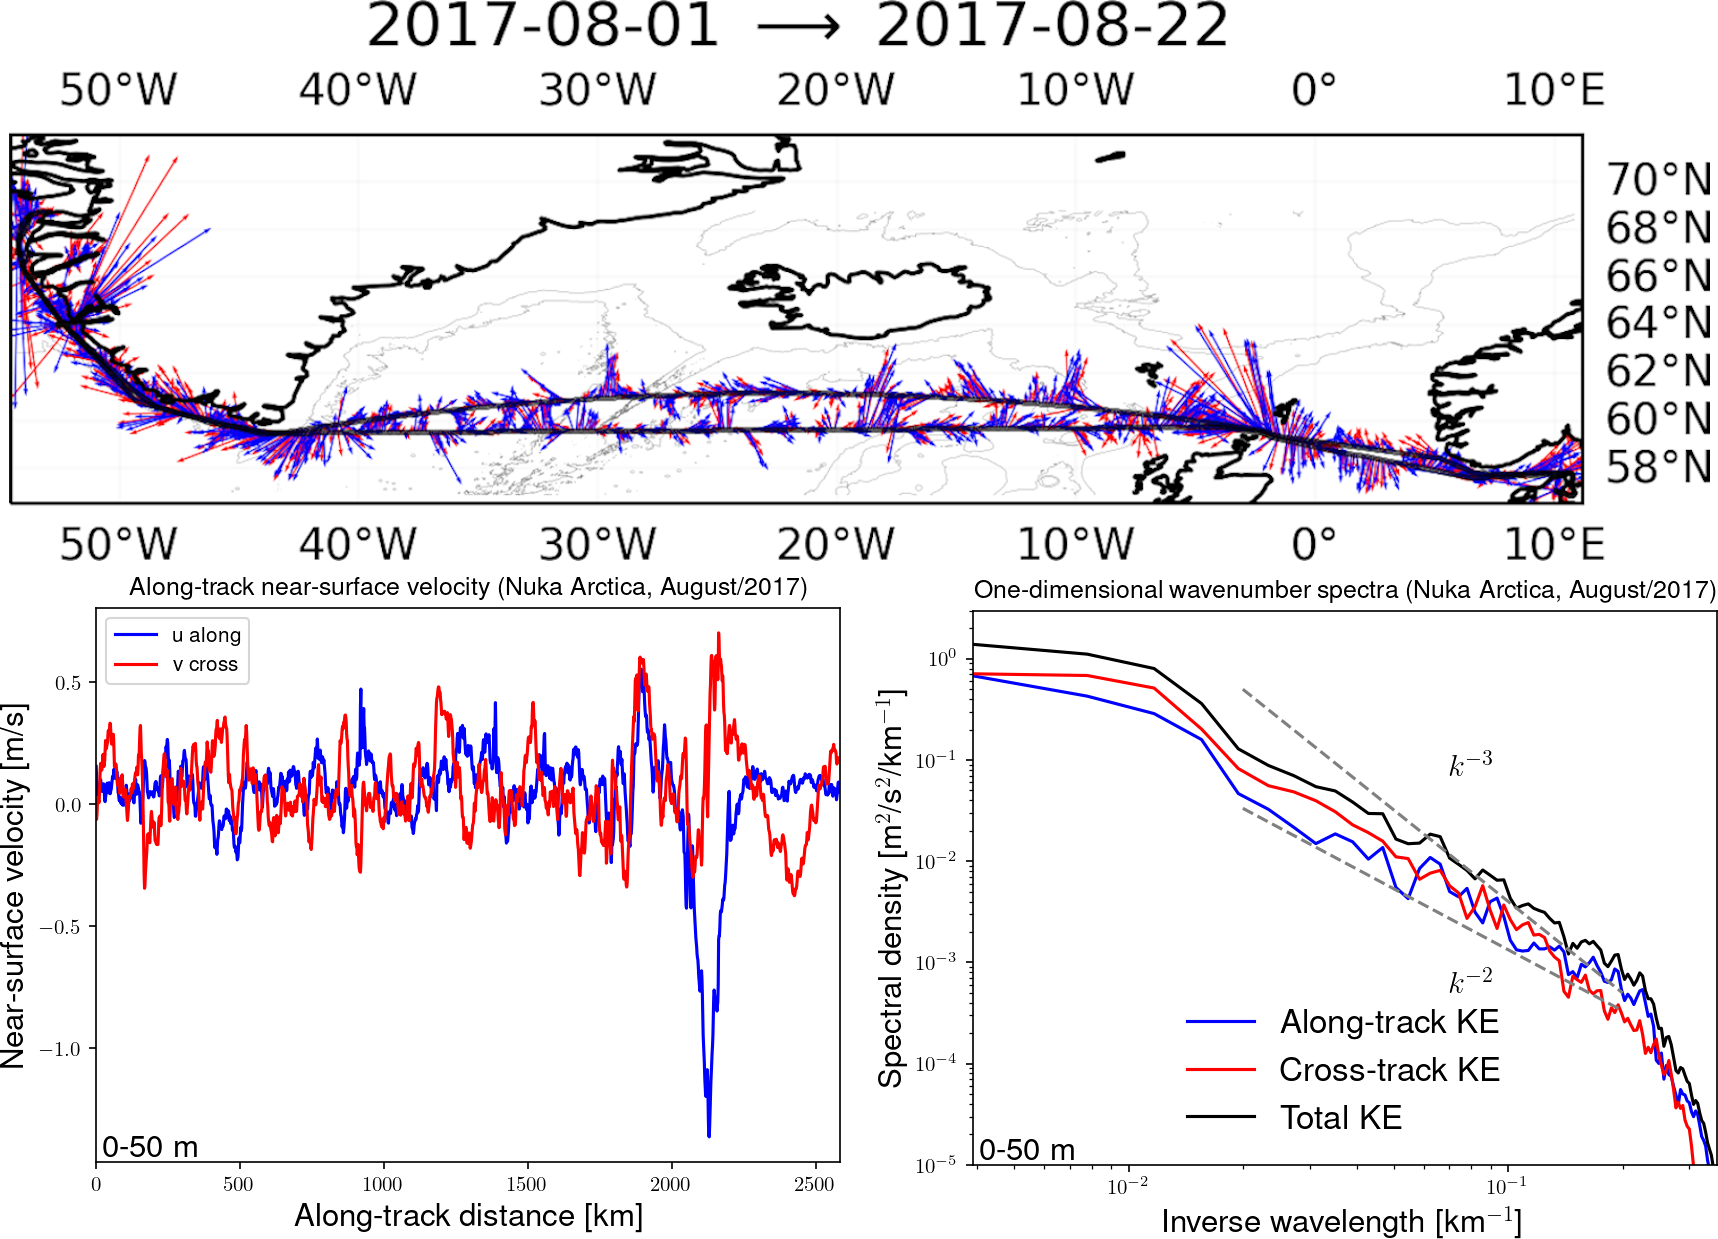
Ocean currents are not always clearly defined and steady. If we measure them along a ship's track, what we most often see are many whirls that we call eddies (top and bottom-left panels of Figure 1). These eddies are like the weather of the ocean, and the way energy is distributed across different scales can give us information about different physical processes in the ocean.
To derive this information from the ship measurements, we calculate kinetic energy wavenumber spectra (bottom-right panel of Figure 1) from the velocity components along (u, blue) and across (v, red) the ship's track and look at characteristics such as their linear slope and the relative energy level of each component (u or v).
In this project, we will use current measurements from an Acoustic Doppler Current Profiler (ADCP) installed on a commercial cargo ship, the Nuka Arctica (http://nuka.uib.no). The ship crosses the North Atlantic frequently between Denmark and Greenland, and the ADCP installed on the ship's hull measures the currents along the way.
The work will involve plotting the ADCP-measured currents, calculating wavenumber spectra from them and interpreting the results in the context of turbulence theories. Thus the student will gain experience with programming and ocean dynamics.
Depending on time and the student's interests, we may also compare wavenumber spectra from a high-resolution simulation of the North Atlantic with the shipboard measurements.