Reducing energy consumption is an important contribution to addressing the climate crisis. UiO’s new Life Science building will be an almost zero energy building; a building that produces as much energy as it consumes. How is this possible? How much energy does a building and its inhabitants use anyways? Are there any rebound effects?
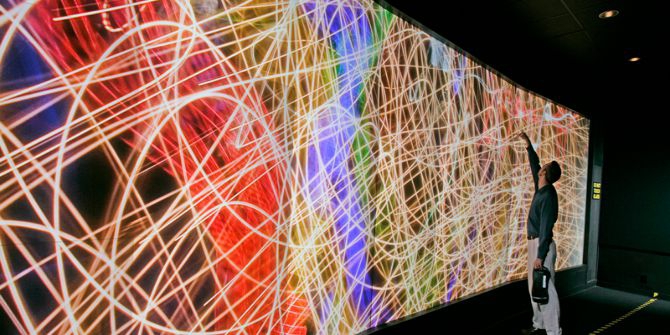
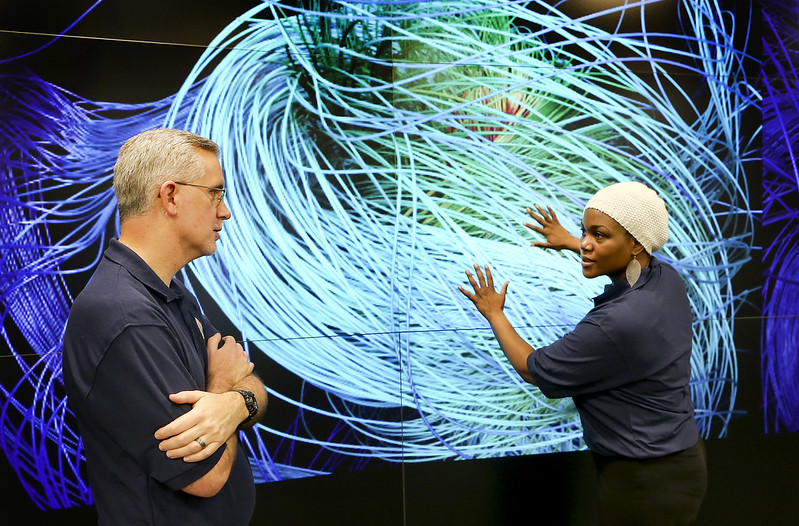
In this master project we answer different research questions (one per master thesis), which together result in an artistic, sustainable, and informative visualisation of energy use in the form of an installation. Since the Life Science building is not yet built, we can offer you an augmented reality (AR) tour of the first floor of the building where such an installation could be placed in the future. For your prototyping and collection of energy use data, you can use the Sustainability Lab and data from the IFI building and/or IFI students and staff (or any other UiO site)
For this master project, we are looking for a team of master students. You don’t have to be an artist to participate in this project! We are looking for students that together provide the required skill set for this project, such as prototyping, programming, creativity, machine learning, and who have an interest in the contextualisation and visualisation of data in an a designerly and informative manner. The aim is to have at least four students working on the project, forming an interdisciplinary team.
Supervision
We regard the social aspect of doing a master thesis as important as the academic aspect. As supervisors we will offer you an engaged and inspiring environment in the Sustainability Lab as well as access to experts when needed, such as people knowledgable about energy use, green house gas emissions, and visualisation. We have a budget for the purchase of materials, tools, and other stuff needed to implement the project.
This master thesis project is part of Circular Energy for a Sustainable Circular Economy (Circular Energy), an UiO:Energy financed project led by the Regenerative Technologies research group. In the project we collaborate with UiO's Law Faculty, Science Library, and Climate House (Klimahuset).
Recommended courses:
- IN5010 (Design, Technology & Society)
- You may also want to choose one of the following courses: IN5120 (Tangible Interaction), IN5530 (Research through Design) or IN5510 (Participatory Experimental Design).
- Data visualization: TEK5600 (Visualisering av vitenskapelig data)
- Other relevant courses related to energy, environment & society, consumption, etc. are described here: https://www.uio.no/english/research/strategic-research-areas/uio-energy/studies/
Inspiring literature and examples:
Murugesan et al. (2015). Design criteria for visualization of energy consumption: A systematic literature review.
Tufte E.R., 2001. The Visual Display of Quantitative Information, Graphics Press LLC, Cheshire (available in the University Library).

